Multiple Choice
Figure 15-2
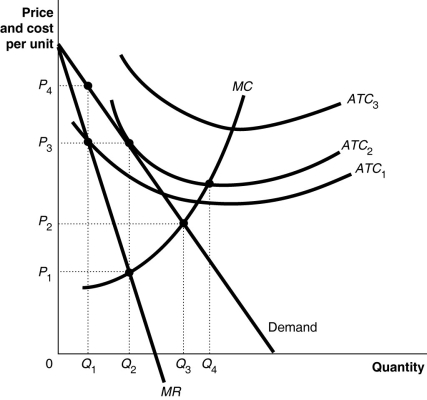
Figure 15-2 above shows the demand and cost curves facing a monopolist.
-Refer to Figure 15-2.To maximize profit, the firm will produce at output level
A) Q₁.
B) Q₂.
C) Q₃.
D) Q₄.
Correct Answer:

Verified
Correct Answer:
Verified
Q231: BHP Billiton is a Canadian company that
Q232: Figure 15-3<br> <img src="https://d2lvgg3v3hfg70.cloudfront.net/TB4193/.jpg" alt="Figure 15-3
Q233: Table 15-2<br> <img src="https://d2lvgg3v3hfg70.cloudfront.net/TB4193/.jpg" alt="Table 15-2
Q234: "Being the only seller in the market,
Q235: Explain whether a monopoly that maximizes profit
Q237: The De Beers Company, one of the
Q238: Identify four reasons for high entry barriers.Briefly
Q239: In regulating a natural monopoly, the price
Q240: The 10-year protection period from generic competition
Q241: Network externalities refer to the situation where