Multiple Choice
Figure 15-2
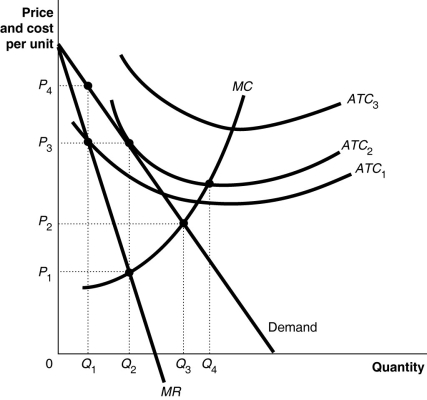
Figure 15-2 above shows the demand and cost curves facing a monopolist.
-Refer to Figure 15-2.If the firm's average total cost curve is ATC₁, the firm will
A) suffer a loss.
B) break even.
C) make a profit.
D) face competition.
Correct Answer:

Verified
Correct Answer:
Verified
Q191: Peet's Coffee and Teas produces some flavorful
Q192: A natural monopoly is characterized by large
Q193: What is a network externality?<br>A)It refers to
Q194: Recently, the NCAA agreed to loosen one
Q195: The Herfindahl-Hirschman Index is one factor used
Q197: Compared to perfect competition, the consumer surplus
Q198: In reality, because few markets are perfectly
Q199: Joe Santos owns the only pizza parlor
Q200: Long-run economic profits would most likely exist
Q201: A snack shop inside a hotel in