Multiple Choice
Figure 15-6
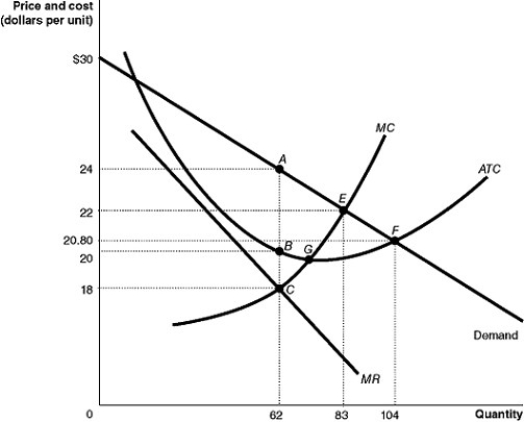
Figure 15-6 shows the cost and demand curves for a monopolist.
-Refer to Figure 15-6.The profit-maximizing output and price for the monopolist are
A) output = 62; price = $24.
B) output = 62; price = $18.
C) output = 83; price = $22.
D) output = 104; price = $20.80.
Correct Answer:

Verified
Correct Answer:
Verified
Q175: A merger between firms at different stages
Q176: The demand curve for a monopoly's product
Q177: Figure 15-17<br> <img src="https://d2lvgg3v3hfg70.cloudfront.net/TB4193/.jpg" alt="Figure 15-17
Q178: Governments grant patents to encourage<br>A)research and development
Q179: Consider an industry that is made up
Q181: Table 15-4<br> <img src="https://d2lvgg3v3hfg70.cloudfront.net/TB4193/.jpg" alt="Table 15-4
Q182: A local electricity-generating company has a monopoly
Q183: Figure 15-4<br> <img src="https://d2lvgg3v3hfg70.cloudfront.net/TB4193/.jpg" alt="Figure 15-4
Q184: Table 15-2<br> <img src="https://d2lvgg3v3hfg70.cloudfront.net/TB4193/.jpg" alt="Table 15-2
Q185: Some economists believe that the economy benefits