Multiple Choice
Figure 15-15
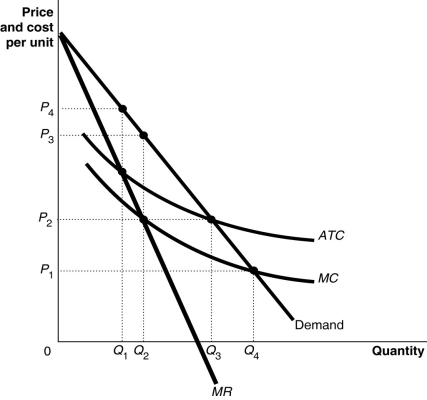
Figure 15-15 shows the cost and demand curves for the Erickson Power Company.
-Refer to Figure 15-15.The profit-maximizing price is
A) P₁.
B) P₂.
C) P₃.
D) P₄.
Correct Answer:

Verified
Correct Answer:
Verified
Q215: Few firms in the United States are
Q216: If a monopolist's marginal revenue is $15
Q217: Many biologic drug manufacturers are pushing for
Q218: Because a monopoly's demand curve is the
Q219: For a natural monopoly to exist,<br>A)a firm
Q221: Figure 15-18<br> <img src="https://d2lvgg3v3hfg70.cloudfront.net/TB4193/.jpg" alt="Figure 15-18
Q222: Figure 15-1<br> <img src="https://d2lvgg3v3hfg70.cloudfront.net/TB4193/.jpg" alt="Figure 15-1
Q223: When the government makes a firm the
Q224: Although some economists believe network externalities are
Q225: The Clayton Act is an antitrust law