Multiple Choice
Figure 15-16
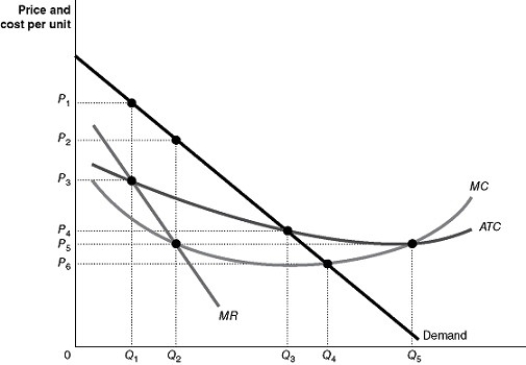
Figure 15-16 shows the market demand and cost curves facing a natural monopoly.
-Refer to Figure 15-16.If the regulators of the natural monopoly allow the owners of the firm to break even on their investment the firm will produce an output of ________ and charge a price of ________.
A) Q₁ units; P₄
B) Q₁ units; P₁
C) Q₅ units; P₃
D) Q₃ units; P₄
Correct Answer:

Verified
Correct Answer:
Verified
Q161: A Herfindahl-Hirschman Index is calculated by<br>A)summing the
Q162: The market demand curve facing a monopolist
Q163: The Federal Trade Commission (FTC)Act<br>A)gave the FTC
Q164: Equilibrium in a perfectly competitive market results
Q165: The U.S.Congress has given two government entities
Q167: If a monopolist's price is $50 per
Q168: Using a broad definition, a firm would
Q169: Governments grant patents to<br>A)compensate firms for research
Q170: Figure 15-10<br> <img src="https://d2lvgg3v3hfg70.cloudfront.net/TB4193/.jpg" alt="Figure 15-10
Q171: Consider two industries, industry W and industry