Multiple Choice
Figure 17-3
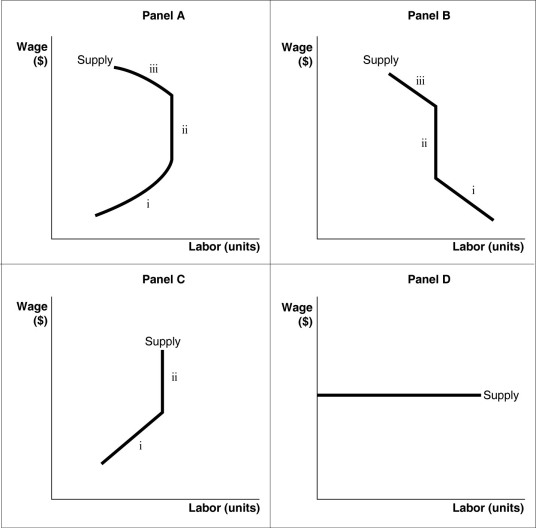
-Refer to Figure 17-3.Which of the panels in the diagram best represents an individual's labor supply curve?
A) Panel A
B) Panel B
C) Panel C
D) Panel D
Correct Answer:

Verified
Correct Answer:
Verified
Related Questions
Q3: A firm's labor demand curve is also
Q4: The supply curve of a uniquely talented
Q5: What happens to the equilibrium wage and
Q6: In 2015, the foreign-born population in the
Q7: Scenario 17-1<br>In academia, professors in some disciplines
Q9: Compensating differentials are<br>A)non-monetary benefits from being employed,
Q10: Wally, Vijay, Sandra, and Consuela make up
Q11: One reason why the average salary of
Q12: Which of the following variables will not
Q13: What is the shape of the labor