Multiple Choice
Figure 18-1
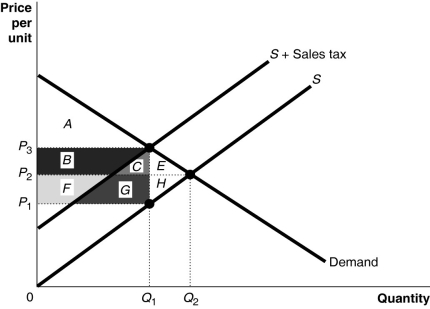
-Refer to Figure 18-1.Area B + C + F + G represents
A) the portion of sales tax revenue borne by consumers.
B) the portion of sales tax revenue borne by producers.
C) the excess burden of the sales tax.
D) sales tax revenue collected by the government.
Correct Answer:

Verified
Correct Answer:
Verified
Q49: Over the past 40 years in the
Q50: Rent-seeking behavior, unlike profit-maximizing behavior in competitive
Q51: What is a Lorenz curve and what
Q52: Figure 18-2<br> <img src="https://d2lvgg3v3hfg70.cloudfront.net/TB4193/.jpg" alt="Figure 18-2
Q53: Explain why it is more difficult to
Q55: Describe the main factors economists believe cause
Q56: Is a typical person likely to gather
Q57: At the state and local levels in
Q58: Table 18-12<br> <img src="https://d2lvgg3v3hfg70.cloudfront.net/TB4193/.jpg" alt="Table 18-12
Q59: The complexity of the U.S.federal income tax