Multiple Choice
Figure 18-2

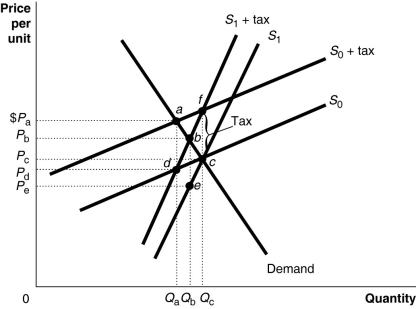
Figure 18-2 shows a demand curve and two sets of supply curves, one set more elastic than the other.
-Refer to Figure 18-2.If the government imposes an excise tax of $1.00 on every unit sold, the producer's burden of the tax
A) is Pₐ - Pd under either supply curve.
B) is Pb - Pₑ under either supply curve.
C) is Pₐ - Pd if the supply curve is S₀ and Pb - Pₑ if the supply curve is S₁.
D) is Pc - Pd if the supply curve is S₀ and Pc - Pₑ if the supply curve is S₁.
Correct Answer:

Verified
Correct Answer:
Verified
Q201: The Gini coefficient for the United States
Q202: Figure 18-7<br> <img src="https://d2lvgg3v3hfg70.cloudfront.net/TB4193/.jpg" alt="Figure 18-7
Q203: What is the relationship between market failure
Q204: During the past 30 years, income inequality
Q205: Logrolling may result in<br>A)legislation that yields economy-wide
Q207: When the demand for a product is
Q208: A key assumption of the public choice
Q209: A key insight of the public choice
Q210: A tax bracket is<br>A)the percent of taxable
Q211: The largest source of revenue for the