Multiple Choice
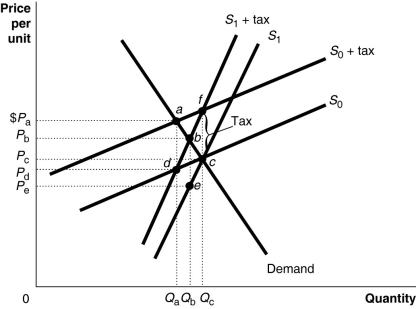
Figure 18-2

Figure 18-2 shows a demand curve and two sets of supply curves, one set more elastic than the other.
-Refer to Figure 18-2.If the government imposes an excise tax of $1.00 on every unit sold, the government's revenue from the tax
A) is larger if the supply curve is S₀.
B) is larger if the supply curve is S₁.
C) is identical under either supply curve.
D) is not maximized.
Correct Answer:

Verified
Correct Answer:
Verified
Q190: In 2016, over 75 percent of the
Q191: What is the difference between the poverty
Q192: Define logrolling.Explain why logrolling often results in
Q193: Explain the effect of price elasticities of
Q194: The federal government and some state governments
Q196: If, as your taxable income decreases, you
Q197: One result of the public choice model
Q198: When the demand for a product is
Q199: If your income is $92,000 and you
Q200: Measures of poverty (for example, the poverty