Multiple Choice
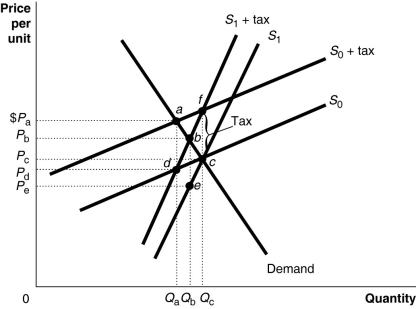
Figure 18-2

Figure 18-2 shows a demand curve and two sets of supply curves, one set more elastic than the other.
-Refer to Figure 18-2.If the government imposes an excise tax of $1.00 on every unit sold,
A) the deadweight loss is identical under either supply curve.
B) the deadweight loss is greater under the supply curve S₁.
C) the deadweight loss is greater under the supply curve S₀.
D) there is no deadweight loss since revenue raised is used to fund government projects.
Correct Answer:

Verified
Correct Answer:
Verified
Q11: If the government wants to minimize the
Q12: Figure 18-9<br> <img src="https://d2lvgg3v3hfg70.cloudfront.net/TB4193/.jpg" alt="Figure 18-9
Q13: Interest paid on home mortgages is deductible
Q14: When considering changes in tax policy, economists
Q15: The horizontal-equity principle of taxation is not
Q17: Compare the distribution of income in the
Q18: Table 18-1<br> <img src="https://d2lvgg3v3hfg70.cloudfront.net/TB4193/.jpg" alt="Table 18-1
Q19: Figure 18-1<br> <img src="https://d2lvgg3v3hfg70.cloudfront.net/TB4193/.jpg" alt="Figure 18-1
Q20: The poverty rate is defined as the
Q21: According to the median voter theorem, the