Essay
Figure 18-3
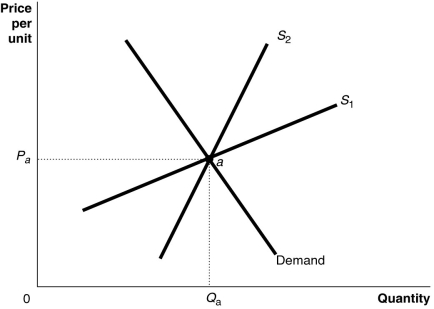
-Refer to Figure 18-3.The figure above shows a demand curve and two supply curves, one more elastic than the other.Use Figure 18-3 to answer the following questions.
a.Suppose the government imposes an excise tax of $1.00 on every unit sold.Use the graph to illustrate the impact of this tax when the supply curve is S₁ and when the supply curve is S₂.
b.If the government imposes an excise tax of $1.00 on every unit sold, will the consumer pay more of the tax if the supply curve is S₁ or S₂? Refer to the graphs in your answer.
c.If an excise tax of $1.00 on every unit sold is imposed, will the revenue collected by the government be greater if the supply curve is S₁ or S₂?
d.If the government imposes an excise tax of $1.00 on every unit sold, will the deadweight loss be greater if the supply curve is S₁ or S₂?
Correct Answer:

Verified
a.The supply curve shifts up by the full...View Answer
Unlock this answer now
Get Access to more Verified Answers free of charge
Correct Answer:
Verified
View Answer
Unlock this answer now
Get Access to more Verified Answers free of charge
Q84: What is the United States government's formal
Q85: Which of the following is an example
Q86: Some economists who use the public choice
Q87: Economist Kenneth Arrow has shown mathematically that
Q88: For the top 1 percent of income
Q90: Which of the following statements about rent
Q91: Former Alabama Governor George Wallace ran for
Q92: The Arrow impossibility theorem<br>A)explains why people can
Q93: What does a Lorenz curve illustrate?<br>A)a comparison
Q94: In the United States, taxpayers are allowed