Multiple Choice
Figure 18-6
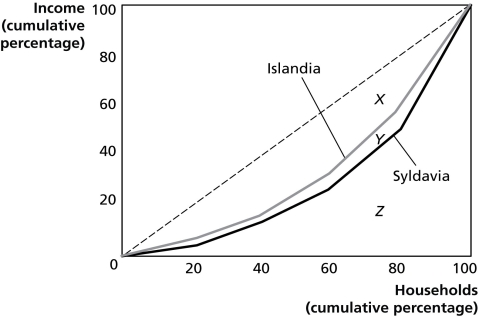
Figure 18-6 shows the Lorenz curves for Islandia and Syldavia.
-Refer to Figure 18-6.If area X = 2,060, area Y = 240, and area Z = 2,700, calculate the Gini coefficient for Islandia.
A) 0.41
B) 0.45
C) 0.70
D) 0.76
Correct Answer:

Verified
Correct Answer:
Verified
Q113: The corporate income tax is ultimately paid
Q114: If your income is $40,000 and you
Q115: Logrolling refers to attempts by individuals to
Q116: The median voter theorem implies that<br>A)many people
Q117: If, as your taxable income decreases, you
Q119: How would the elimination of a sales
Q120: According to the benefits-received principle of taxation<br>A)individuals
Q121: A tax is efficient if it imposes
Q122: For a given supply curve, how does
Q123: Figure 18-1<br> <img src="https://d2lvgg3v3hfg70.cloudfront.net/TB4193/.jpg" alt="Figure 18-1