Multiple Choice
Figure 24.3
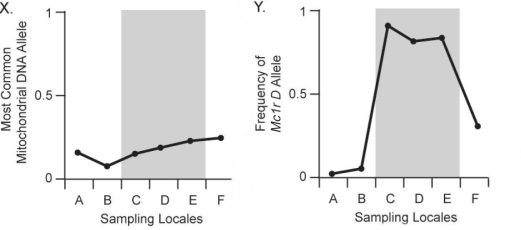
-In Figure 24.3,chart X above shows the frequency of the most common neutral mitochondrial DNA allele (an allele for a gene that does not affect and is not linked to coat color) across six pocket-mouse populations.Populations C,D,and E live on dark volcanic rock;populations A,B,and F live on light-colored granite.Compare this figure with chart Y above.What should you conclude after comparing these two figures?
A) The most common neutral mitochondrial DNA allele is strongly associated with substrate color.
B) The most common neutral mitochondrial DNA allele is strongly associated with the frequency of the Mc1r D allele.
C) The most common neutral mitochondrial DNA allele varies more among populations than does the Mc1r D allele.
D) Little to no correlation exists between neutral mitochondrial DNA alleles and habitat color.
Correct Answer:

Verified
Correct Answer:
Verified
Q6: A farmer uses triazine herbicide to control
Q7: Which of the following statements is an
Q8: An individual with a novel adaptation has
Q9: There is a population of beetles that
Q10: Fossils of Thrinaxodon,a species that lived during
Q12: Gill pouches in chick,human,and house-cat embryos are
Q13: Which of the following,if discovered,could refute our
Q14: Tourist companies start visiting Island X,where a
Q15: Figure 24.1<br>The following question(s)are based on information
Q16: Why was Darwin and Wallace's theory of