Multiple Choice
Figure 31.5
Use the graphs in Figures 31.4 and 31.5 and the following information when answering the corresponding questions.
Canadian and Swiss researchers (van der Heijden et al. ,1998) ,interested in factors affecting biodiversity,grew a variety of grassland plants in combination with one of four arbuscular mycorrhizal (AMF) species,no AMF,or all four AMF species together;and they measured plant growth under each set of conditions.All plant species were grown in each plot,so they always competed with each other with the only difference being which AMF were present.Use the graphs in Figure 31.5 to answer the questions that follow.Note that the x-axis labels indicate the number and identity of AMF species (bar 0 = no fungi;bars A-D = individual AMF species;bar A+B+C+D = all AMF species together) .The y-axis indicates the amount (grams) of plant biomass for the species shown in italics above each graph.Graph (e) is the total biomass (grams) of all 11 plant species combined;graph (f) is the biomass of Bromus erectus plants only,separated from the total.
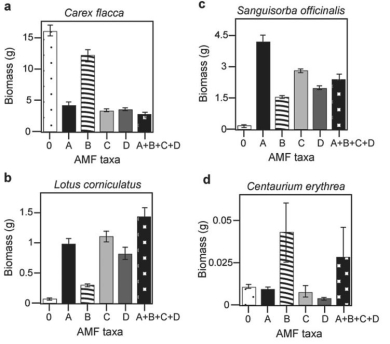
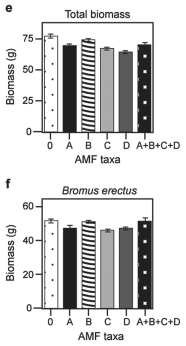
Figure 31.4 Figure 31.5
-Why does total biomass (graph e Figure 31.5) not vary with AMF diversity?
A) Plant growth is unaffected by fungal diversity.
B) Most of the plants in this system do not form mycorrhizal associations.
C) Bromus is the dominant plant species.
D) Lotus corniculatus is a rare species.
Correct Answer:

Verified
Correct Answer:
Verified
Q4: You want to run an experiment to
Q5: Use the following information when answering the
Q7: You are a forester charged with increasing
Q9: Fungi have an extremely high surface-area-to-volume ratio.What
Q9: Based on the idea that fungi have
Q10: You observe the gametes of a fungal
Q12: Figure 31.4<br>Use the following information when answering
Q13: Figure 31.5<br>Use the graphs in Figures 31.4
Q25: Some fungal species can kill herbivores while
Q46: Why is it more difficult to treat