Multiple Choice
Figure 50.3
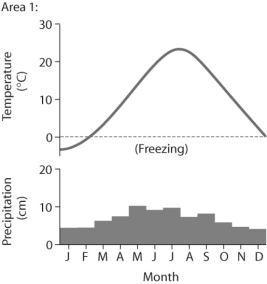
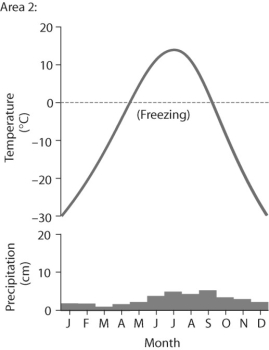
-Based on the data in Figure 50.3,which of the following statements is false?
A) Area 1 has more average precipitation than Area 2.
B) Area 1 has a higher average temperature than Area 2.
C) Both areas have low variation in monthly precipitation.
D) Area 2 has a lower annual temperature variation compared to Area 1.
Correct Answer:

Verified
Correct Answer:
Verified
Q12: What is the main difference between climate
Q13: Use the following abstract from the International
Q14: Figure 50.1<br> <img src="https://d2lvgg3v3hfg70.cloudfront.net/TB3734/.jpg" alt="Figure 50.1
Q15: Which of the following organisms is likely
Q18: The carnivorous pitcher plant is successful in
Q19: Theoretically, which would be the most effective
Q20: Cheatgrass has been able to invade dry,temperate
Q21: Figure 50.1<br> <img src="https://d2lvgg3v3hfg70.cloudfront.net/TB3734/.jpg" alt="Figure 50.1
Q22: Which of the following is not a
Q35: What would happen to the seasons if