Multiple Choice
Figure 52.8 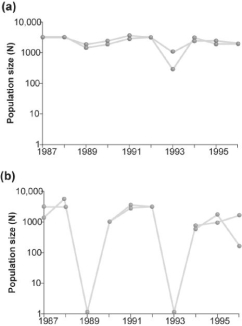
-The graph (b) in Figure 52.8 shows the normal fluctuations of a population of grouse.Assuming graph (a) in Figure 52.8 is the result of some experimental treatment in the grouse population,what can be concluded?
A) The experimental treatment exacerbated the population cycling.
B) The experimental treatment did not affect population cycling in this species.
C) The experimental treatment has most likely identified the cause of population cycling.
D) None of the above answers applies.
Correct Answer:

Verified
Correct Answer:
Verified
Q1: Why can't a female lizard have both
Q2: Which of the following statements regarding the
Q4: Figure 52.3 <img src="https://d2lvgg3v3hfg70.cloudfront.net/TB3734/.jpg" alt="Figure 52.3
Q5: Figure 52.5 <img src="https://d2lvgg3v3hfg70.cloudfront.net/TB3734/.jpg" alt="Figure 52.5
Q7: Figure 52.9 <img src="https://d2lvgg3v3hfg70.cloudfront.net/TB3734/.jpg" alt="Figure 52.9
Q9: What can we not determine from examining
Q10: Which of these terms defines how the
Q11: The study of factors that determine the
Q49: Conservationists will take snow geese off the
Q51: What is the primary limiting factor that