Multiple Choice
Figure 53.7 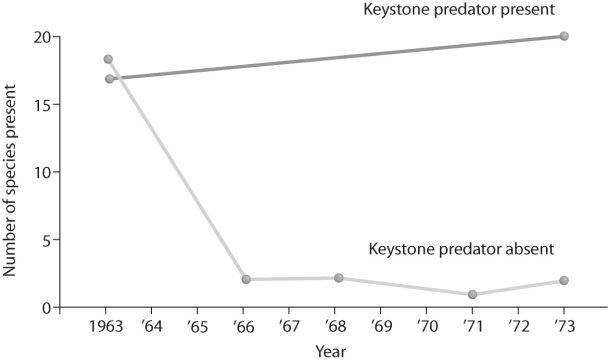
-What does the graph in Figure 53.7 tell you about the definition of a keystone species?
A) A keystone species has little interaction with other species in an environment.
B) Removing a keystone species from the community drastically reduces diversity.
C) Adding a keystone species to the community will make it more robust.
D) A keystone species added to the community can make it more robust.
E) Removing a keystone species from the community will eventually allow for the invasion of a new species.
Correct Answer:

Verified
Correct Answer:
Verified
Q5: Which are the only two interaction types
Q6: Figure 53.1 <img src="https://d2lvgg3v3hfg70.cloudfront.net/TB3734/.jpg" alt="Figure 53.1
Q7: Some birds follow moving swarms of army
Q9: The competitive exclusion principle states that _.<br>A)it
Q11: Figure 53.6 <img src="https://d2lvgg3v3hfg70.cloudfront.net/TB3734/.jpg" alt="Figure 53.6
Q12: Bouchard and Brooks studied the effect of
Q13: In biology,an arms race occurs when _.<br>A)predators
Q14: Figure 53.9 <img src="https://d2lvgg3v3hfg70.cloudfront.net/TB3734/.jpg" alt="Figure 53.9
Q15: Figure 53.4 <img src="https://d2lvgg3v3hfg70.cloudfront.net/TB3734/.jpg" alt="Figure 53.4
Q50: Which one of the following animals would