Multiple Choice
Figure 54.3 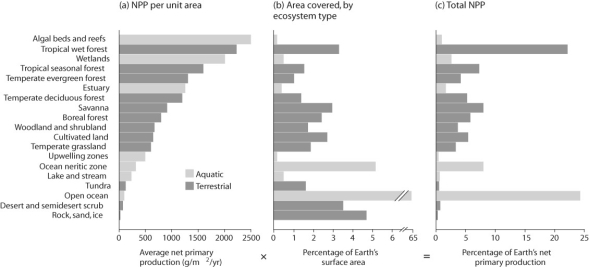
-Figure 54.3 represents net primary productivity in what way?
A) organized by biome
B) organized by geography
C) organized by region
D) randomly organized
Correct Answer:

Verified
Correct Answer:
Verified
Q8: When primary producers expend energy to build
Q12: Which of the following most often controls
Q15: Which of the following could be a
Q16: Considering the global carbon cycle,where is the
Q17: Figure 54.9 <img src="https://d2lvgg3v3hfg70.cloudfront.net/TB3734/.jpg" alt="Figure 54.9
Q19: Figure 54.10 <img src="https://d2lvgg3v3hfg70.cloudfront.net/TB3734/.jpg" alt="Figure 54.10
Q20: Figure 54.9 <img src="https://d2lvgg3v3hfg70.cloudfront.net/TB3734/.jpg" alt="Figure 54.9
Q21: Figure 54.9 <img src="https://d2lvgg3v3hfg70.cloudfront.net/TB3734/.jpg" alt="Figure 54.9
Q22: Figure 54.1<br>-How are the components in Figure
Q23: Use the following information when answering the