Multiple Choice
Figure 3.1
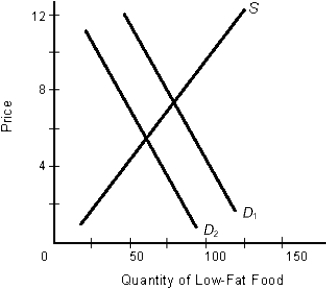
-According to Figure 3.1, as represented by the shift from D1 to D2,
A) the demand for low-fat food has risen.
B) the quantity of low-fat food supplied has declined.
C) eating low-fat food may have become popular.
D) consumer tastes for low-fat food may have risen.
E) consumer tastes for high-fat food may have fallen.
Correct Answer:

Verified
Correct Answer:
Verified
Q34: Figure 3.7<br> <img src="https://d2lvgg3v3hfg70.cloudfront.net/TB1749/.jpg" alt="Figure 3.7
Q35: "Efficiency" means you get the same amount
Q36: It is very difficult for a firm
Q37: Rent control is<br>A) a situation where a
Q38: Which of the following is not correct?<br>A)
Q40: Individual states may set their own minimum
Q41: <img src="https://d2lvgg3v3hfg70.cloudfront.net/TB1749/.jpg" alt=" -Refer to Table
Q42: In the 1980s, Japanese automobile manufacturers, fearing
Q43: <img src="https://d2lvgg3v3hfg70.cloudfront.net/TB1749/.jpg" alt=" -Refer to Table
Q44: Rent control results in a(n)<br>A) shortage of