Multiple Choice
Figure 3.1
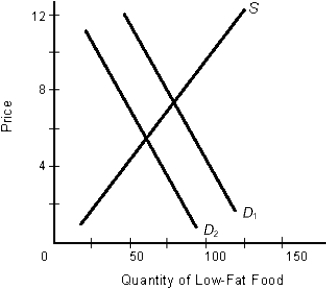
-According to Figure 3.1, as represented by the shift from D1 to D2,
A) the demand for low-fat meals has risen.
B) the quantity of resources used in the production of low-fat meals has risen.
C) consumer income may have risen.
D) consumer tastes for low-fat meals may have declined.
E) consumer tastes for resources may have fallen.
Correct Answer:

Verified
Correct Answer:
Verified
Q55: Figure 3.6<br> <img src="https://d2lvgg3v3hfg70.cloudfront.net/TB1749/.jpg" alt="Figure 3.6
Q56: An example of creative destruction is a
Q57: On a graph showing the supply and
Q58: Which is not an example of creative
Q59: Figure 3.7<br> <img src="https://d2lvgg3v3hfg70.cloudfront.net/TB1749/.jpg" alt="Figure 3.7
Q61: The U.S. economy has shifted from _
Q62: A ban has the effect of _
Q63: Many companies have moved jobs from the
Q64: Figure 3.7<br> <img src="https://d2lvgg3v3hfg70.cloudfront.net/TB1749/.jpg" alt="Figure 3.7
Q65: If each of the following jobs paid