Multiple Choice
Figure 3.2
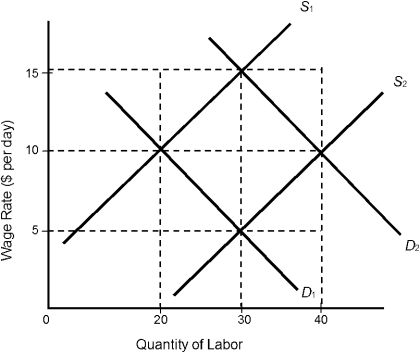
-In Figure 3.2, if the market is in equilibrium with 30 workers at a wage rate of $15 per day, which of the following must be the corresponding labor supply and demand curves?
A) S1 and D1
B) S1 and D2
C) S2 and D1
D) S2 and D2
E) Cannot be determined from the information given
Correct Answer:

Verified
Correct Answer:
Verified
Q47: States with a higher minimum wage than
Q48: Which of the following influence the level
Q49: The compensating wage differential shows a labor
Q50: To earn more than what the free
Q51: A minimum wage is a price floor.
Q53: The price system induces people to employ
Q54: Figure 3.5<br> <img src="https://d2lvgg3v3hfg70.cloudfront.net/TB1749/.jpg" alt="Figure 3.5
Q55: Figure 3.6<br> <img src="https://d2lvgg3v3hfg70.cloudfront.net/TB1749/.jpg" alt="Figure 3.6
Q56: An example of creative destruction is a
Q57: On a graph showing the supply and