Multiple Choice
Figure 12.1
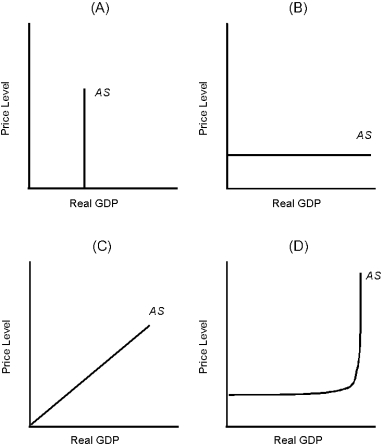
-Which of the graphs in Figure 12.1 is consistent with a short-run equilibrium model where prices are variable?
A) A
B) B
C) C
D) D
E) None of these
Correct Answer:

Verified
Correct Answer:
Verified
Related Questions
Q7: Other things equal, the steeper the aggregate
Q8: In an attempt to understand an economy's
Q9: To determine short-run equilibrium in the economy,
Q10: Which of the following will not cause
Q11: Household expenditures increase as a result of<br>A)
Q13: The long-run aggregate supply curve corresponds to
Q14: Which of the following will not shift
Q15: Macroeconomic equilibrium occurs at the intersection of
Q16: Of the following, which is not held
Q17: The main reason the short-run aggregate supply