Multiple Choice
Figure 12.2
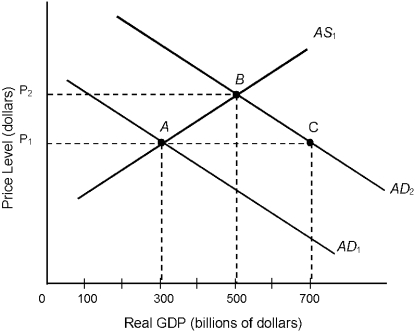
-Consider the economy described in Figure 12.2. At point C,
A) businesses produce more than consumers want to spend.
B) inventories deplete, which pushes the price up to its new equilibrium.
C) inventories accumulate, which pushes the price down to its new equilibrium.
D) real GDP is below its equilibrium level.
E) the economy is in equilibrium.
Correct Answer:

Verified
Correct Answer:
Verified
Q104: Why is the long-run aggregate supply curve
Q105: The short-run aggregate supply curve will not
Q106: U.S. economic growth in the twenty-first century
Q107: Because demand-pull inflation is caused by an
Q108: In the mid-2000s, the world price of
Q110: All of the following lead to a
Q111: Assume that a large number of workers
Q112: The short-run aggregate supply curve is<br>A) a
Q113: Which of the following statements is true?<br>A)
Q114: In deriving the short-run aggregate supply curve,