Multiple Choice
Figure 12.3
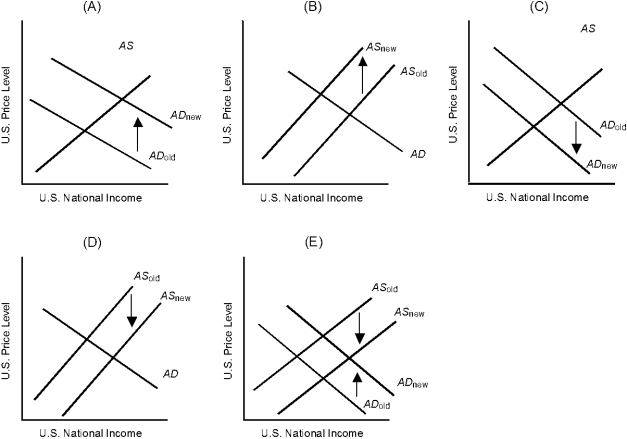
-Which of the graphs in Figure 12.3 best describes the impact of lower real income in Germany on U.S. equilibrium income and the U.S. equilibrium price level?
A) A
B) B
C) C
D) D
E) E
Correct Answer:

Verified
Correct Answer:
Verified
Related Questions
Q45: A rightward shift of the aggregate demand
Q46: In the short run, an increase in
Q47: A leftward shift of the aggregate demand
Q48: We would expect higher interest rates on
Q49: A decline in production costs<br>A) reduces the
Q51: The short-run aggregate supply curve shifts to
Q52: In the 1970s, the world price of
Q53: One of the goals of macroeconomic policy
Q54: The aggregate quantity of goods and services
Q55: Demand-pull inflation occurs when there is a