Multiple Choice
Figure 12.3
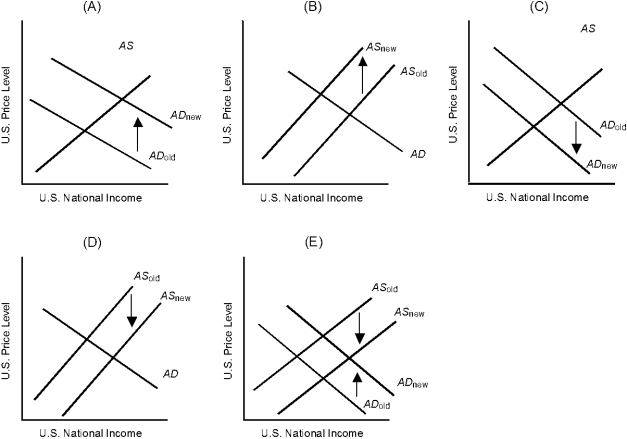
-Which of the graphs in Figure 12.3 describes the impact of domestic real wage increases on U.S. equilibrium income and the U.S. equilibrium price level?
A) A
B) B
C) C
D) D
E) E
Correct Answer:

Verified
Correct Answer:
Verified
Q23: Which of the following statements is true?<br>A)
Q24: Figure 12.2<br> <img src="https://d2lvgg3v3hfg70.cloudfront.net/TB1749/.jpg" alt="Figure 12.2
Q25: The substitution effect, based on relative commodity
Q26: An upward-sloping aggregate supply curve indicates that<br>A)
Q27: By not allowing its currency to appreciate,
Q29: Figure 12.4<br> <img src="https://d2lvgg3v3hfg70.cloudfront.net/TB1749/.jpg" alt="Figure 12.4
Q30: Which of the following statements concerning the
Q31: Net exports are equal to imports minus
Q32: The aggregate demand curve will not shift
Q33: When aggregate demand increases, all of the