Figure 3-6 These Figures Illustrate the Production Possibilities Available to Barney and Barney
Multiple Choice
Figure 3-6
These figures illustrate the production possibilities available to Barney and Betty with eight hours of labour in their bakery. 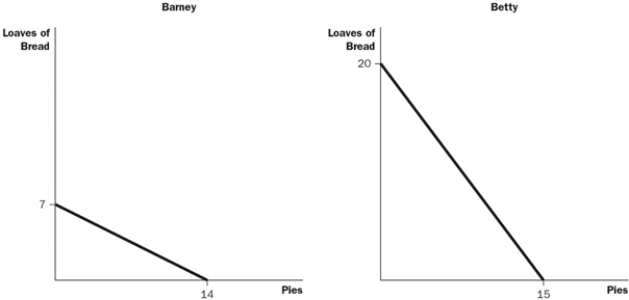
-Refer to Figure 3-6. What is the opportunity cost of one loaf of bread for Barney?
A) 1/4 pie
B) 1/2 pie
C) 1 pie
D) 2 pies
Correct Answer:

Verified
Correct Answer:
Verified
Q14: <img src="https://d2lvgg3v3hfg70.cloudfront.net/TB7554/.jpg" alt=" -Refer to Table
Q16: Figure 3-3<br>Ice cream and cones are measured
Q17: Figure 3-5<br>These graphs illustrate the production possibilities
Q18: Figure 3-2 <img src="https://d2lvgg3v3hfg70.cloudfront.net/TB7554/.jpg" alt="Figure 3-2
Q20: <img src="https://d2lvgg3v3hfg70.cloudfront.net/TB7554/.jpg" alt=" -Refer to Table
Q21: Figure 3-3<br>Ice cream and cones are measured
Q22: What should a country do if it
Q23: <img src="https://d2lvgg3v3hfg70.cloudfront.net/TB7554/.jpg" alt=" -Refer to Table
Q24: What are exports?<br>A) limits placed on the
Q91: Differences in opportunity cost allow for gains