Essay
The "two-country,two-good" model (sometimes called the 2×2 model) of comparative advantage that we have studied so far is simple,insightful,and compelling.However,its very simplicity turns out to be its weakness.In the real world,when many countries produce many goods,the simple 2×2 model is of limited use in predicting patterns of trade.To see how complex such a model can become,let us consider a 2×3 model (two countries,1 and 2,and three goods,A,B,and C.) The following table gives the maximum amounts (units) of each good that each country can produce if all the country's resources were used in the production of the respective good.In other words,the table describes each country's production possibilities frontier. 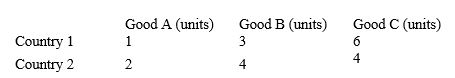
a.How do the production possibilities frontiers for each of the two countries look in a three-dimensional coordinate system? (Draw three axes like a corner in your room, and label them after the three goods: A, B, and C.Then, place the number of units for each good for Country 1on its respective axis and connect the three intercepts by straight lines.Repeat for Country 2 on a separate graph.)?
b.Calculate the opportunity costs of good A in terms of B and C in each country and call these prices PA1 and PA2 respectively.?
c.Calculate the opportunity costs of good B in terms of A and C in each country and call these prices PB1 and PB2 respectively.?
d.Calculate the opportunity costs of good C in terms of A and B in each country and call these prices PC1 and PC2 respectively.?
e.Based on your calculations, can you tell which country should export or import each product based on comparative advantage?
Correct Answer:

Verified
a. 
b.PA1 = 3B = 6C (the price of good ...View Answer
Unlock this answer now
Get Access to more Verified Answers free of charge
Correct Answer:
Verified
b.PA1 = 3B = 6C (the price of good ...
View Answer
Unlock this answer now
Get Access to more Verified Answers free of charge
Q9: Figure 3-2 <img src="https://d2lvgg3v3hfg70.cloudfront.net/TB7554/.jpg" alt="Figure 3-2
Q36: <img src="https://d2lvgg3v3hfg70.cloudfront.net/TB7554/.jpg" alt=" -Refer to Table
Q49: Suppose that a worker in Agland can
Q60: <img src="https://d2lvgg3v3hfg70.cloudfront.net/TB7554/.jpg" alt=" -Refer to Table
Q91: Differences in opportunity cost allow for gains
Q100: Both Canada and the U.S. can produce
Q112: According to Adam Smith, what should a
Q128: Figure 3-2 <img src="https://d2lvgg3v3hfg70.cloudfront.net/TB7554/.jpg" alt="Figure 3-2
Q166: Suppose that a worker in Radioland can
Q194: Why does total output in an economy