Multiple Choice
Figure 5-7
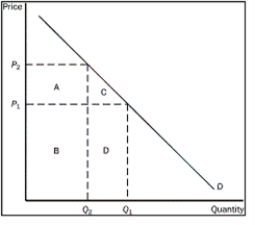
-Refer to Figure 5-7.What areas represent total revenue at P₂
A) A + B
B) A + C
C) B + D
D) C + D
Correct Answer:

Verified
Correct Answer:
Verified
Related Questions
Q36: Your younger sister needs $80 to buy
Q37: What is the difference between slope and
Q38: If a demand curve is horizontal,what are
Q39: Figure 5-2<br> <img src="https://d2lvgg3v3hfg70.cloudfront.net/TB1272/.jpg" alt="Figure 5-2
Q40: To determine whether a good is considered
Q42: Moving down a linear demand curve,what happens
Q43: If the quantity supplied responds only slightly
Q44: A bakery would be willing to supply
Q45: What is the concept of elasticity used
Q46: Knowing that the demand for wheat is