Multiple Choice
Figure 5-9
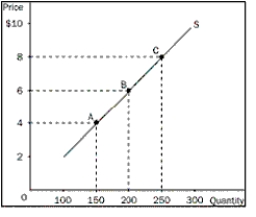
-Refer to Figure 5-9.What is the price elasticity of supply from point A to point C,using the midpoint method
A) 0.375
B) 0.750
C) 1.330
D) 2.670
Correct Answer:

Verified
Correct Answer:
Verified
Q130: Figure 5-5<br> <img src="https://d2lvgg3v3hfg70.cloudfront.net/TB1272/.jpg" alt="Figure 5-5
Q131: Generally,over which time period will a firm
Q132: Figure 5-5<br> <img src="https://d2lvgg3v3hfg70.cloudfront.net/TB1272/.jpg" alt="Figure 5-5
Q133: Suppose that 100 candy bars are demanded
Q134: In each of the following cases,do you
Q136: Suppose the price of Twinkle snack cakes
Q137: The local Greek restaurant makes such great
Q138: What does a flatter demand curve represent<br>A)greater
Q139: A linear demand curve has constant elasticity,but
Q140: When demand is inelastic,what will a decrease