Multiple Choice
Figure 7-2
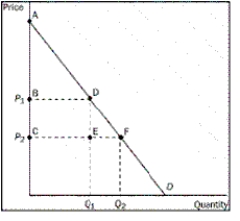
-Refer to Figure 7-2.Which area represents the increase in consumer surplus when the price falls from P₁ to P₂
A) ABD
B) ACF
C) BCED
D) BCFD
Correct Answer:

Verified
Correct Answer:
Verified
Q32: Joel has a 1966 Mustang, which he
Q58: What is the sum of out-of-pocket expenses
Q59: Tammy loves doughnuts.The table shown reflects the
Q60: Market demand is given as Q<sub>D </sub>=
Q61: Table 7-3<br> <img src="https://d2lvgg3v3hfg70.cloudfront.net/TB1272/.jpg" alt="Table 7-3
Q63: Market demand is given as Q<sub>D </sub>=
Q64: Figure 7-6<br><br> <img src="https://d2lvgg3v3hfg70.cloudfront.net/TB1272/.jpg" alt="Figure 7-6
Q65: Market demand is given as Q<sub>D </sub>=
Q66: Figure 7-4<br> <img src="https://d2lvgg3v3hfg70.cloudfront.net/TB1272/.jpg" alt="Figure 7-4
Q166: Welfare economics is the study of the