Multiple Choice
Figure 7-3
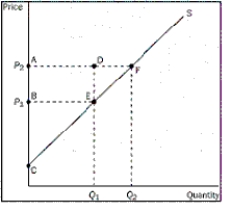
-Refer to Figure 7-3.When the price rises from P₁ to P₂,which area represents the increase in producer surplus to existing producers
A) ACF
B) BCE
C) ABED
D) DEF
Correct Answer:

Verified
Correct Answer:
Verified
Related Questions
Q111: Market demand is given as Q<sub>D </sub>=
Q113: What does the area below a demand
Q114: Table 7-4<br> <img src="https://d2lvgg3v3hfg70.cloudfront.net/TB1272/.jpg" alt="Table 7-4
Q115: Market demand is given as Q<sub>D </sub>=
Q117: Efficiency is related to the size of
Q118: In order for market outcomes to maximize
Q119: At Nick's Bakery,the cost to make Nick's
Q120: The area above the demand curve and
Q121: Table 7-4<br> <img src="https://d2lvgg3v3hfg70.cloudfront.net/TB1272/.jpg" alt="Table 7-4
Q181: Total surplus in a market is consumer