Multiple Choice
Figure 7-5
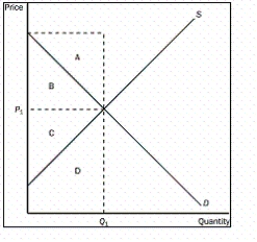
-Refer to Figure 7-5.What area represents consumer surplus when the price is P₁
A) A
B) B
C) C
D) D
Correct Answer:

Verified
Correct Answer:
Verified
Q84: What does total surplus in a market
Q85: Figure 7-6<br><br> <img src="https://d2lvgg3v3hfg70.cloudfront.net/TB1272/.jpg" alt="Figure 7-6
Q86: When the market price increases,producer surplus increases
Q87: Consider the following equation: P = 0.5Q.Answer
Q88: Figure 7-6<br><br> <img src="https://d2lvgg3v3hfg70.cloudfront.net/TB1272/.jpg" alt="Figure 7-6
Q91: Which area is producer surplus<br>A)the area under
Q92: Suppose a consumer is willing and able
Q93: Table 7-2<br> <img src="https://d2lvgg3v3hfg70.cloudfront.net/TB1272/.jpg" alt="Table 7-2
Q94: Why can a supply curve be used
Q108: Figure 7-2<br> <img src="https://d2lvgg3v3hfg70.cloudfront.net/TB1272/.jpg" alt="Figure 7-2