Multiple Choice
Figure 8-4
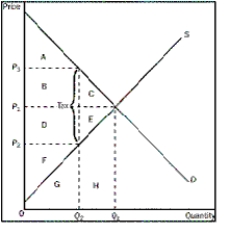
-Refer to Figure 8-4.Which area represents the loss in total welfare resulting from the levying of the tax on the seller
A) A + B + C
B) A + B + D + F
C) C + E
D) D + E + F
Correct Answer:

Verified
Correct Answer:
Verified
Q15: If the supply curve is more elastic,all
Q16: Figure 8-5<br> <img src="https://d2lvgg3v3hfg70.cloudfront.net/TB1272/.jpg" alt="Figure 8-5
Q17: Figure 8-2<br> <img src="https://d2lvgg3v3hfg70.cloudfront.net/TB1272/.jpg" alt="Figure 8-2
Q18: The more inelastic the demand and supply
Q19: Figure 8-6<br> <img src="https://d2lvgg3v3hfg70.cloudfront.net/TB1272/.jpg" alt="Figure 8-6
Q21: Which statement best summarizes the idea of
Q22: What does deadweight loss represent<br>A)the reduction in
Q23: Figure 8-5<br> <img src="https://d2lvgg3v3hfg70.cloudfront.net/TB1272/.jpg" alt="Figure 8-5
Q24: Figure 8-3<br> <img src="https://d2lvgg3v3hfg70.cloudfront.net/TB1272/.jpg" alt="Figure 8-3
Q25: Assume that the supply of gasoline is