Multiple Choice
Figure 10-6
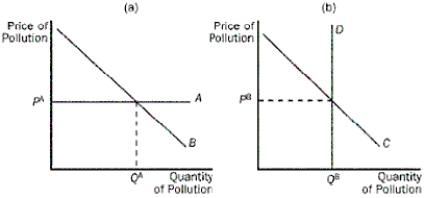
-Refer to Figure 10-6.Which curve best represents a corrective tax
A) A
B) B
C) neither
D) both could represent a corrective tax depending on the industry being taxed
Correct Answer:

Verified
Correct Answer:
Verified
Related Questions
Q198: How have policymakers chosen to solve the
Q199: If only a few people are affected
Q200: What does research into new technologies lead
Q201: Suppose that large-scale pork production has the
Q202: Dog owners do not bear the full
Q204: Both pollution permits and corrective taxes are
Q205: When the social cost curve is above
Q206: When do negative externalities occur<br>A)when one person's
Q207: Two firms,A and B,each currently dump 50
Q208: What will internalizing a negative externality cause