Multiple Choice
Figure 13-2
The figure depicts a total cost function for a firm that produces cookies.
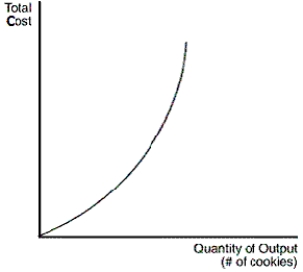
-Refer to Figure 13-2.Which statement describes the shape of the total-cost curve
A) Producing an additional cookie always costs more that the cost of producing the previous cookie.
B) Total production of cookies decreases with additional units of input.
C) Producing additional cookies is equally costly, regardless of how many cookies were previously produced.
D) Producing additional cookies becomes increasingly costly only when the number of cookies previously produced is large.
Correct Answer:

Verified
Correct Answer:
Verified
Q25: The shape of the marginal cost curve
Q110: Figure 13-4<br>The curves in this figure reflect
Q111: A certain firm manufactures and sells computer
Q112: What is the relationship between economic profit
Q113: What is added to profit to obtain
Q115: Which of the following equations explains the
Q116: Which term refers to the amount of
Q117: If marginal cost is below average total
Q118: What is the term for things that
Q156: If the average total cost curve is