Multiple Choice
Figure 13-5
This figure depicts average total cost functions for a firm that produces automobiles.
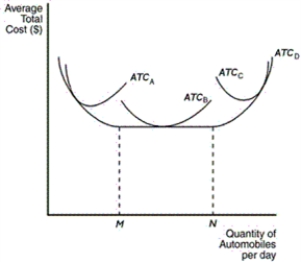
-Refer to Figure 13-5.Which of the curves is most likely to characterize the short-run average-total-cost curve of the smallest factory
A) ATCA
B) ATCB
C) ATCC
D) ATCD
Correct Answer:

Verified
Correct Answer:
Verified
Q43: At all levels of production beyond the
Q44: What does diminishing marginal product suggest<br>A)Additional units
Q45: Suppose adding another unit of labour leads
Q46: In the long run,what happens to inputs<br>A)Inputs
Q49: What is the fundamental reason that marginal
Q50: When marginal cost exceeds average total cost,what
Q51: The fact that many decisions are fixed
Q52: If the marginal-cost curve is rising,so is
Q53: Figure 13-6<br> <img src="https://d2lvgg3v3hfg70.cloudfront.net/TB1272/.jpg" alt="Figure 13-6
Q91: As a firm moves along its long-run