Multiple Choice
Figure 13-5
This figure depicts average total cost functions for a firm that produces automobiles.
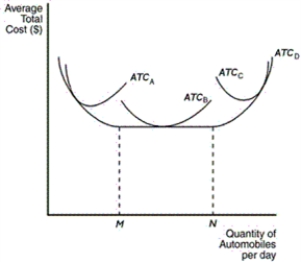
-Refer to Figure 13-5.Which curve represents the long-run average total cost
A) ATCA
B) ATCB
C) ATCC
D) ATCD
Correct Answer:

Verified
Correct Answer:
Verified
Related Questions
Q32: The production function depicts a relationship between
Q33: Which of the following can be explained
Q37: What is the firm's efficient scale<br>A)the quantity
Q38: For a certain firm,the number of workers
Q39: What does variable cost divided by quantity
Q40: Scenario 13-4<br>A firm experiences decreasing marginal product
Q41: Some costs do NOT vary with the
Q83: Several related measures of cost can be
Q209: The average-total-cost curve is unaffected by diminishing
Q243: Variable costs usually change as the firm