Multiple Choice
Figure 13-5
This figure depicts average total cost functions for a firm that produces automobiles.
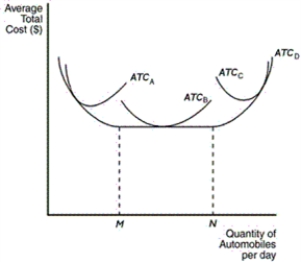
-Refer to Figure 13-5.At levels of output below M,what does the firm experience
A) economies of scale
B) diseconomies of scale
C) economic profit
D) accounting profit
Correct Answer:

Verified
Correct Answer:
Verified
Q25: The shape of the marginal cost curve
Q102: What would be an example of an
Q103: Table 13-1<br> <img src="https://d2lvgg3v3hfg70.cloudfront.net/TB1272/.jpg" alt="Table 13-1
Q104: If a firm wants to capitalize on
Q105: When is average total cost increasing<br>A)whenever total
Q106: What is one of the most important
Q108: Table 13-1<br> <img src="https://d2lvgg3v3hfg70.cloudfront.net/TB1272/.jpg" alt="Table 13-1
Q110: Figure 13-4<br>The curves in this figure reflect
Q111: A certain firm manufactures and sells computer
Q112: What is the relationship between economic profit