Multiple Choice
Figure 15-3
The figure below reflects the cost and revenue structure for a monopoly firm.
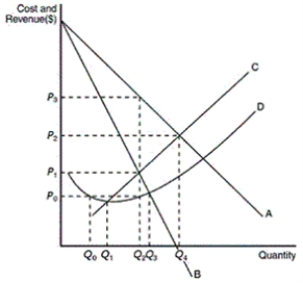
-Refer to Figure 15-3.What would profit be on a typical unit sold for a profit-maximizing monopoly
A) P₂ - P₀
B) P₂ - P₁
C) P₃ - P₀
D) P₃ - P₁
Correct Answer:

Verified
Correct Answer:
Verified
Q219: What is the key difference between a
Q220: Consider a profit-maximizing monopoly pricing under the
Q221: For a profit-maximizing monopolist,when should output be
Q222: How is a monopolist's profit-maximizing quantity of
Q223: What shape of demand curves do competitive
Q225: Which statement represents a monopoly firm<br>A)A monopoly
Q226: A monopoly firm can sell 200 units
Q227: Price discrimination explains why many universities often
Q228: When does a natural monopoly arise<br>A)when there
Q229: What shape of demand curves do monopoly