Multiple Choice
Figure 18-3
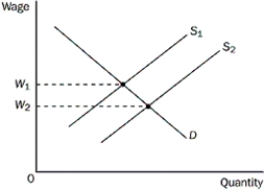
-Refer to Figure 18-3.What could possibly explain the shift of the labour supply curve from S₁ to S₂
A) an increase in technology
B) a change in the price of firms' output
C) a change in workers' attitudes toward the work-leisure trade-off
D) an increase in workers' productivity
Correct Answer:

Verified
Correct Answer:
Verified
Q121: For competitive firms,the curve that represents the
Q122: When does the labour supply curve shift<br>A)when
Q123: Scenario 18-1<br>Madison Kelp owns three boats, which
Q124: Figure 18-2<br> <img src="https://d2lvgg3v3hfg70.cloudfront.net/TB1272/.jpg" alt="Figure 18-2
Q125: If a disease were to significantly decrease
Q127: Charles owns one of many bakeries in
Q128: Table 18-1<br> <img src="https://d2lvgg3v3hfg70.cloudfront.net/TB1272/.jpg" alt="Table 18-1
Q129: The labour supply curve reflects how workers'
Q130: Because of diminishing returns,what role does a
Q131: Aurora Custom Cabinets produces and sells custom