Multiple Choice
Figure 21-2
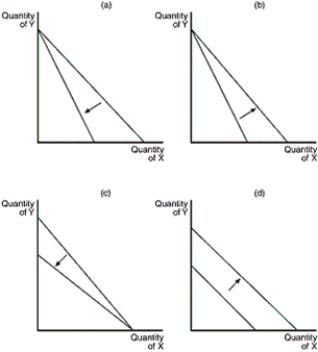
-Refer to Figure 21-2.Which of the graphs in the figure reflects a decrease in the price of good X only
A) graph (a)
B) graph (b)
C) graph (c)
D) graph (d)
Correct Answer:

Verified
Correct Answer:
Verified
Related Questions
Q63: Giffen goods are inferior goods for which
Q76: Assume that a college student spends all
Q77: How can we define the marginal rate
Q78: If the consumption of one good is
Q79: If leisure were an inferior good,what shape
Q80: What do indifference curves graphically represent<br>A)an income
Q82: What the term for the point where
Q83: Figure 21-3<br> <img src="https://d2lvgg3v3hfg70.cloudfront.net/TB1272/.jpg" alt="Figure 21-3
Q84: A rise in the interest rate will
Q86: What does it mean when a budget