Multiple Choice
Figure 21-2
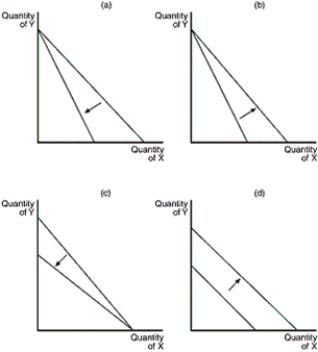
-Refer to Figure 21-2.Which of the graphs in the figure reflects an increase in consumer's income
A) graph (a)
B) graph (b)
C) graph (c)
D) graph (d)
Correct Answer:

Verified
Correct Answer:
Verified
Related Questions
Q26: Refer to Scenario 21-1 in your textbook.What
Q27: The marginal rate of substitution does NOT
Q28: What can we say about the amount
Q29: Economists use the term Giffen good to
Q30: Figure 21-3<br> <img src="https://d2lvgg3v3hfg70.cloudfront.net/TB1272/.jpg" alt="Figure 21-3
Q32: In what direction will an increase in
Q33: A consumer is currently consuming some of
Q34: Uta consumes two normal goods,X and Y,and
Q35: At the consumer's optimum,the consumer's valuation of
Q36: Use consumer choice theory to explain why