Multiple Choice
Figure 21-6
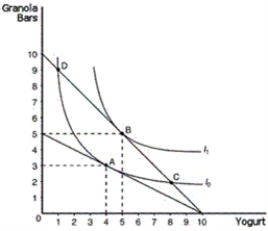
-Refer to Figure 21-6.Assume that the consumer depicted in the figure faces prices and income such that she optimizes at point B.According to the graph,what change forces the consumer to move to point A
A) a decrease in the price of yogurt
B) a decrease in the price of granola bars
C) an increase in the price of yogurt
D) an increase in the price of granola bars
Correct Answer:

Verified
Correct Answer:
Verified
Q43: Explain the difference between inferior and normal
Q174: What does the bowed shape of the
Q175: For normal goods like cola and pizza,what
Q176: If goods X and Y are perfect
Q177: As one moves down a typical indifference
Q178: The substitution effect of a price change
Q180: What do economists studying the policy of
Q181: Figure 21-1<br> <img src="https://d2lvgg3v3hfg70.cloudfront.net/TB1272/.jpg" alt="Figure 21-1
Q182: Figure 21-3<br> <img src="https://d2lvgg3v3hfg70.cloudfront.net/TB1272/.jpg" alt="Figure 21-3
Q184: Given a consumer's indifference map,how may the