Multiple Choice
Figure 21-8
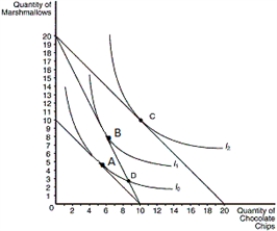
-Refer to Figure 21-8.Assume that the consumer depicted has an income of $50.Which price-quantity combination would be on her demand curve for marshmallows if the price of a bag of chocolate chips is $5
A) $2.50, 4
B) $2.50, 10
C) $5.00, 4
D) $5.00, 10
Correct Answer:

Verified
Correct Answer:
Verified
Q43: Explain the difference between inferior and normal
Q181: Figure 21-1<br> <img src="https://d2lvgg3v3hfg70.cloudfront.net/TB1272/.jpg" alt="Figure 21-1
Q182: Figure 21-3<br> <img src="https://d2lvgg3v3hfg70.cloudfront.net/TB1272/.jpg" alt="Figure 21-3
Q184: Given a consumer's indifference map,how may the
Q185: Table 21-1<br>The relationship between the marginal utility
Q187: Assume that a person consumes two goods,coffee
Q188: Draw indifference curves that reflect the following:<br>a.pencils
Q189: What is the substitution effect from an
Q190: In which way will an increase in
Q191: When leisure is a normal good,what is