Essay
The OLAP cube shown in Figure 33.1 has been prepared for a car rental company that rents out cars to customers throughout the UK. The company wishes to explore which manufacturer, model, engine size and trim (interior finish) generates the most rental income in each location of the UK. For example, the manufacturer Ford has various models including Mondeo, Fiesta and Ka and each model comes in various size of engine such as 1.8 or 1.6 with each available in one of three trim levels of high, medium and low.
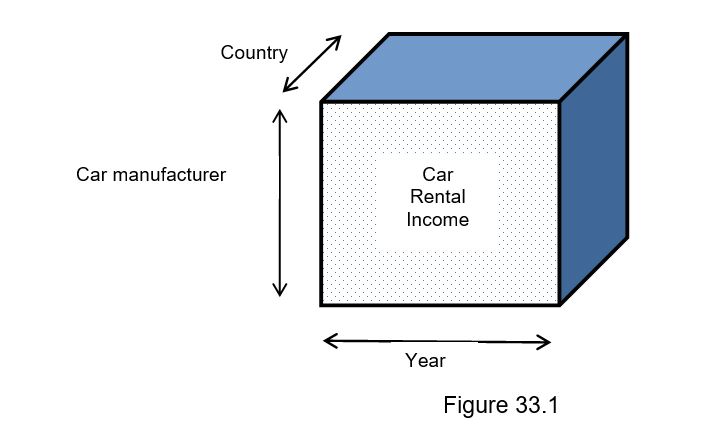
-Present typical dimensional hierarchies (with 4 levels of aggregation) for each dimension shown in Figure 1. The highest level of aggregation for each dimension is shown in Figure 33.1.
Correct Answer:

Verified
Correct Answer:
Verified
Q1: Identify the factors that have led to
Q2: The OLAP cube shown in the figure
Q3: There are a growing number of data
Q4: The OLAP cube shown in Figure 33.1
Q5: The OLAP cube shown in the figure
Q6: The OLAP cube shown in the figure
Q7: Explain why a data warehouse is well
Q8: Data mining can provide huge paybacks for
Q10: Discuss the relationship between data mining, OLAP
Q11: The OLAP cube shown in Figure 33.1