Multiple Choice
Use the figure below to answer the following question(s) .
Figure 4-7
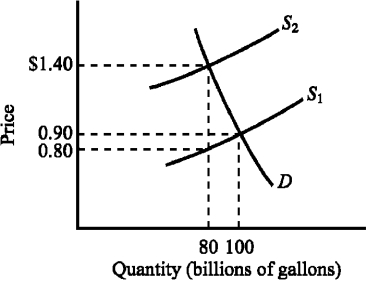
-Refer to Figure 4-7.The supply curve S₁ and the demand curve D indicate initial conditions in the market for gasoline.A $.60-per-gallon excise tax on gasoline is levied,which shifts the supply curve from S₁ to S₂.Imposing the tax causes the equilibrium price of gasoline to increase from
A) $.80 to $1.40.
B) $.80 to $1.50.
C) $.90 to $1.50.
D) $.90 to $1.40.
Correct Answer:

Verified
Correct Answer:
Verified
Q37: When the purchase of a good is
Q43: Suppose the market equilibrium price of corn
Q99: When several hurricanes hit Florida in 2004,
Q110: Figure 4-24<br> <img src="https://d2lvgg3v3hfg70.cloudfront.net/TB3951/.jpg" alt="Figure 4-24
Q151: If an increase in the government-imposed minimum
Q178: When a government subsidy is granted to
Q244: Figure 4-25 <img src="https://d2lvgg3v3hfg70.cloudfront.net/TB7348/.jpg" alt="Figure 4-25
Q257: Other things constant, as the price of
Q261: Suppose the equilibrium price of a physical
Q262: Suppose the federal excise tax rate on