Multiple Choice
Use the figure below to answer the following question(s) .
Figure 4-8
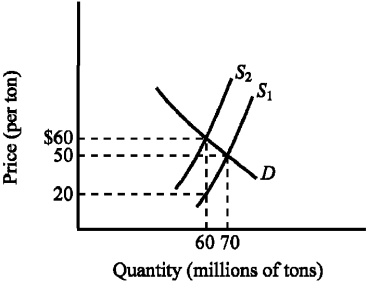
-Refer to Figure 4-8.The supply curve S₁ and the demand curve D indicate initial conditions in the market for soft coal.A $40-per-ton tax on soft coal is levied,shifting the supply curve from S₁ to S₂.Imposing the tax increases the equilibrium price of soft coal from
A) $20 to $60 per ton.
B) $20 to $50 per ton.
C) $50 to $60 per ton.
D) $50 to $90 per ton.
Correct Answer:

Verified
Correct Answer:
Verified
Q37: Use the figure below to answer the
Q85: The deadweight loss resulting from levying a
Q88: If the government wants to raise tax
Q124: Which of the following examples illustrates a
Q162: The actual incidence (or burden) of a
Q168: Which of the following is the most
Q174: A progressive tax is defined as a
Q238: Which tax rate measures the percent of
Q240: The more elastic the supply of a
Q258: Which of the following is a true