Multiple Choice
Use the figure below to answer the following question(s) .
Figure 4-10 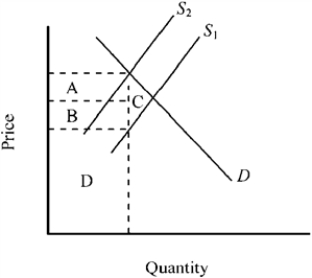
-Figure 4-10 shows the market for a good before and after an excise tax is imposed. What does the triangular area C represent?
A) the deadweight loss accompanying the tax
B) the tax revenue derived from sellers
C) the tax revenue derived from buyers
D) the total tax revenue generated by the tax
Correct Answer:

Verified
Correct Answer:
Verified
Q30: Under rent control, tenants can expect<br>A) lower
Q31: Figure 4-25 <img src="https://d2lvgg3v3hfg70.cloudfront.net/TB7348/.jpg" alt="Figure 4-25
Q32: A subsidy is defined as<br>A) a payment
Q33: Suppose the demand curve for a good
Q34: Suppose that a tax is placed on
Q36: The imposition of price ceilings on a
Q37: Use the figure below to answer the
Q38: Which of the following examples illustrates a
Q39: When a supply and demand model is
Q40: A price ceiling that sets the price