Multiple Choice
Use the figure below to answer the following question(s) .
Figure 4-10 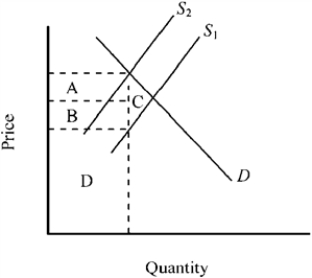
-Refer to Figure 4-10. The accompanying graph shows the market for a good before and after an excise tax is imposed. The total tax revenue generated is indicated by
A) area A + area B + area D.
B) area A + area B + area C.
C) area A + area B.
D) area D only.
Correct Answer:

Verified
Correct Answer:
Verified
Q215: An income tax is defined as regressive
Q216: When the top marginal tax rates were
Q217: Figure 4-18 <img src="https://d2lvgg3v3hfg70.cloudfront.net/TB7348/.jpg" alt="Figure 4-18
Q218: Use the figure below to answer the
Q219: A tax for which the average tax
Q221: How would an increase in the price
Q222: The benefit of a subsidy will go
Q223: Emma works full time during the day
Q224: How would a decrease in lumber prices
Q225: Figure 4-20 <img src="https://d2lvgg3v3hfg70.cloudfront.net/TB7348/.jpg" alt="Figure 4-20