Multiple Choice
Use the figure below to answer the following question(s) .
Figure 4-12
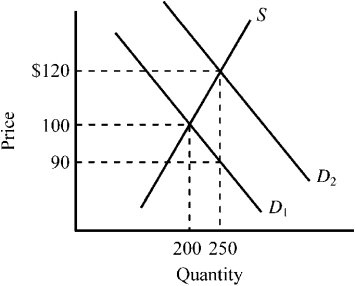
-Refer to Figure 4-12.The supply curve S and the demand curve D₁ indicate initial conditions in the market for college textbooks.A new government program is implemented that grants students a $30 per textbook subsidy on every textbook they purchase,shifting the demand curve from D₁ to D₂.Which of the following is true for this subsidy given the information provided in the exhibit?
A) The original average selling price of textbooks was $100,and after the subsidy it rises to $120.
B) $90 represents the net price a buyer must pay for a textbook after taking into account the subsidy payment.
C) Textbook buyers will receive an actual benefit of $10 from the subsidy,while textbook sellers will receive an actual benefit of $20 from the subsidy.
D) All of the above are true.
Correct Answer:

Verified
Correct Answer:
Verified
Q35: Use the figure below to answer the
Q136: Susan works as an advertising executive for
Q142: The statutory incidence (or burden) of a
Q148: Figure 4-20 <img src="https://d2lvgg3v3hfg70.cloudfront.net/TB7348/.jpg" alt="Figure 4-20
Q156: Suppose that a tax is placed on
Q188: If we observe long lines of people
Q191: Figure 4-14 <img src="https://d2lvgg3v3hfg70.cloudfront.net/TB7348/.jpg" alt="Figure 4-14
Q232: An increase in the number of students
Q247: A proportional tax is defined as a
Q321: Figure 4-25<br> <img src="https://d2lvgg3v3hfg70.cloudfront.net/TB3951/.jpg" alt="Figure 4-25